1 Simulating random numbers
There are a number of functions in R that you can use to simulate random numbers according to different probability distributions.
The function sample allows you to take a sample of the specified size from the elements of a vector x using sampling with or without replacement. You can use ?sample to read the documentation describing the command.
In the following, we will use the sample function to make 10,000 draws from the set of numbers 1, 2, 3 and 4 and display the distribution of the sampled values using a histogram.
First, we define a vector called x which contains the numbers 1, 2, 3, and 4. The function c allows us to combine these four numbers together into one vector:
We now use the function sample to pick from those four numbers in x 10,000 times. The result, the 10,000 numbers chosen, is store in out:
Lets plot a histogram of the values picked:
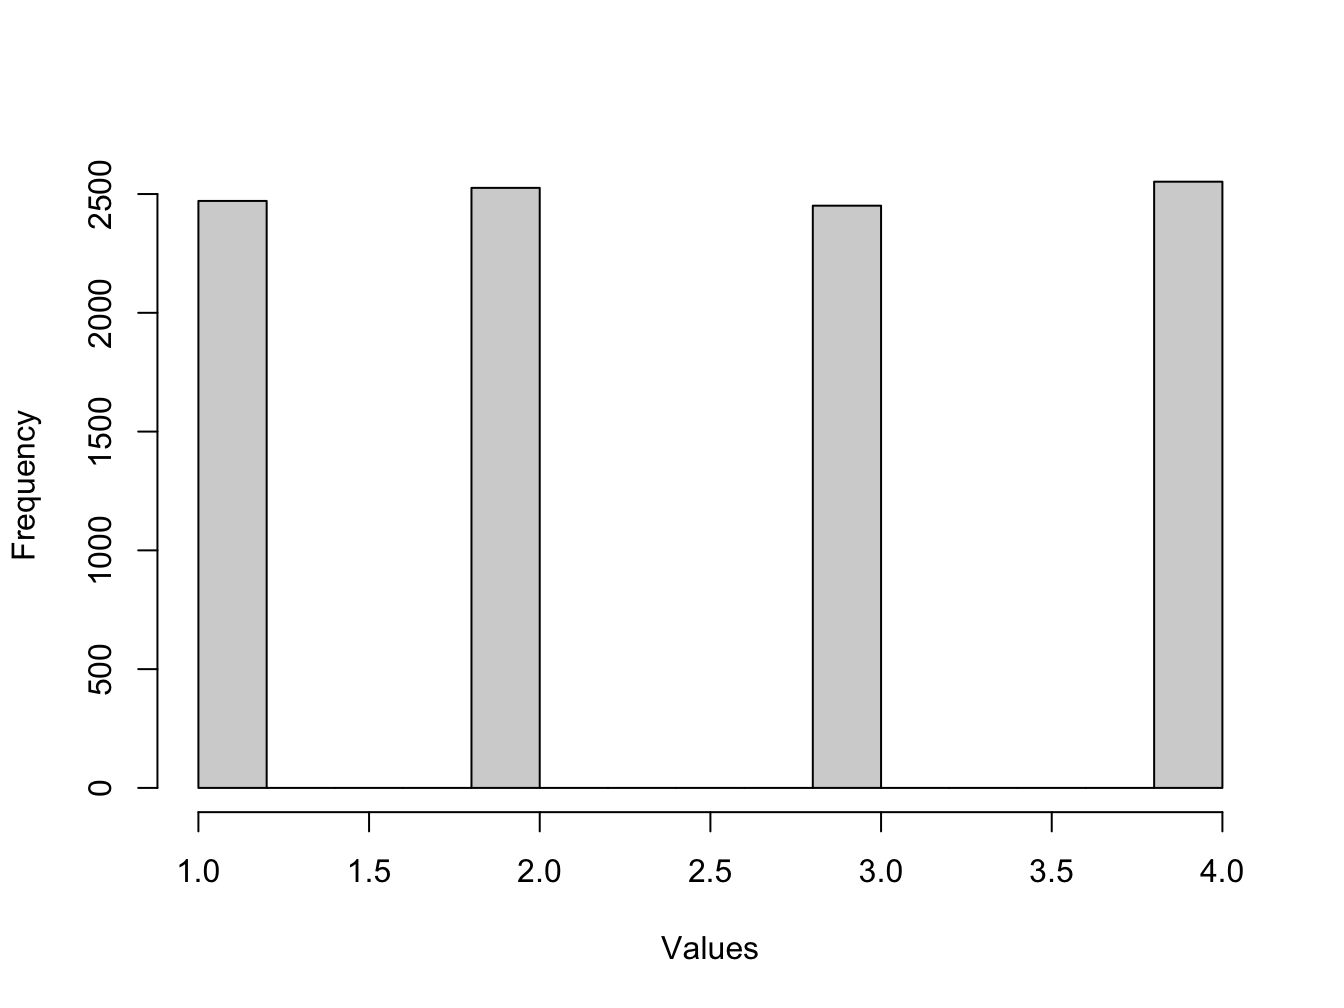
We picked each number with equal probability so the histogram shows each number is equally likely to have been chosen.
1.2 Exercise - using sample
Use the
sampleorsample.intfunction to simulate values from rolls of an unbiased six-sided die. Show that the distribution of values you obtain is consistent with an unbiased die.
Hint 1: Type ?sample.int in the console to get help on this function.
Hint 2: You may find it useful to use the function table. Type ?table in the console to get help on this function.